Project Gantt Chart
A Gantt Chart is a visual representation of the time line of one or more Projects, showing where applicable, predecessors and the amount of work that has already been carried out.
The Gantt Chart can be viewed from the following Locations in the Projects Module:
- From the Projects Grid - highlight one or more Projects and click Gantt Chart
 .
. - From the Project input panel, General sub navigation - click Gantt Chart .
- From the Project input panel, Task Groups sub navigation - click Gantt Chart .
New Tasks and Task Groups can be added to the Project by clicking the ![]() New Task or
New Task or ![]() New Task Group toolbar buttons:
New Task Group toolbar buttons:
- Task Groups without Tasks are not shown in the Gantt Chart
- The appropriate Task Group must be selected when creating new Tasks
Available from 5.5.0.0
The Gantt Chart can be exported by clicking the Export to PDF toolbar button.
Available from 5.5.0.0
Project, Task Groups or Tasks records can be opened directly from the left section of the Gantt Chart by double clicking on the desired row(s).
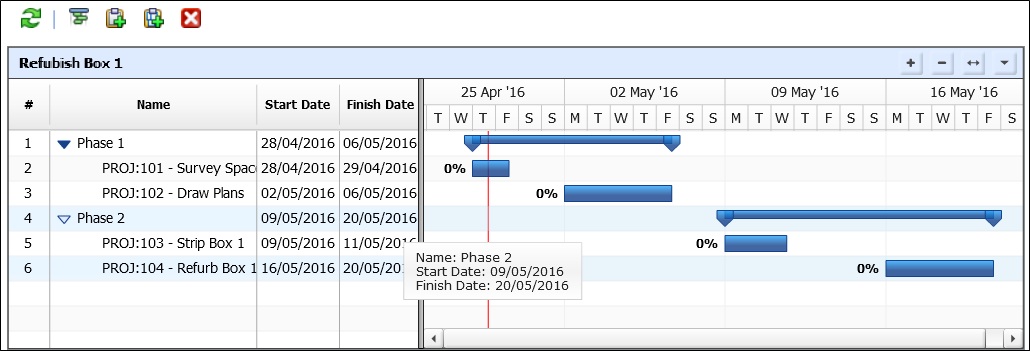
The Gantt Chart shows:
- Day, Week, Month and Year views of the Project(s)
- A List of Tasks grouped by their Task Groups (left hand column)
- A visual representation of the time allocated to each Task (right hand pane) showing Tasks that are in the same Task Group under a group bar
- Any Predecessors for Tasks (represented by the lines joining two Tasks)
- A percentage complete number for each row in the chart, weighted to take into account the hierarchy of the project:
- The Project percentage complete is based upon the percentage complete of all Task Groups in the Project
- The Task Group percentage complete figure is based upon the percentage complete of all Tasks in the Task Group
- Coloured progress bars to give a visual representation of the completion of Projects, Task Groups and Tasks
-
Available from 5.5.1.0
- Tasks coloured by their status and percentage complete:
- Ontime

- Late

- In Progress

- A red vertical line is displayed to show the current date and time
-
Available from 5.5.0.0
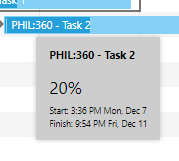
- Hovering the mouse over the horizontal coloured bars of Projects, Task Groups and Tasks will display a popup summary window containing the respective Name, Percent Complete as well as Start and Finish Dates: