Live View Summaries
Available from 4.3.0
Summaries connect to System Queries within the Live View Widget, the Summaries are then used to group and colour information. Applying Colour Ranges to the summary will dictate what colour will appear in the Live View Widget if the number of entities falls in that range.
Summaries can use one of a number of aggregate functions to provide a number:
- Count
- Sum
- Maximum
- Minimum
- Average
This list of Live View Summaries is maintained here.
Settings > Widget Setup > Live View Summaries
The link will open the Live View Summaries grid. It is a grid view which can be searched, sorted and customised as normal.
To add a new Live View Summary click New ![]() , to edit an existing Live View Summary click Edit
, to edit an existing Live View Summary click Edit ![]() . A pop up window will appear which will allow the creation or amendment of a Live View Summary.
. A pop up window will appear which will allow the creation or amendment of a Live View Summary.
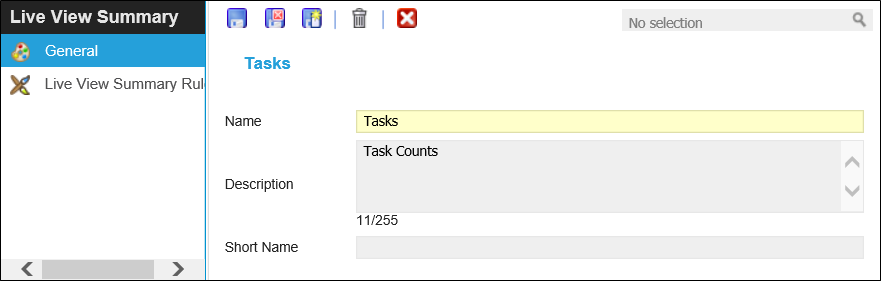
 Click to view - Live View Summaries Fields and Descriptions
Complete the fields and click Save ![]() . Once the Live View Summary header has been completed and saved a sub navigation will appear to allow additional entities to be created.
. Once the Live View Summary header has been completed and saved a sub navigation will appear to allow additional entities to be created.
These include:
- Live View Summary Rules
Live View Summary Rules
Live View Summary Rules allow the colouration rules to be set. Once the Summary has been created colour ranges can be added to determine the colour a summary will turn in the Live View Widget if met.
Settings > Widget Setup > Live View Summaries - Live View Summary Rules
Click to view - Live View Summary Rules Fields and Descriptions
To add colour ranges click New ![]() , a new colour range will be added to be configured.
, a new colour range will be added to be configured.